     [,1] [,2] [,3]
[1,]   10   13   16
[2,]   11   14   17
[3,]   12   15   18
Problem set 1
due Monday, September 8, 2025 at 11:59am
- Instructions
-
Upload your
.ipynbnotebook to gradescope by 11:59am on the due date. Please include your name, Problem set 1, and any collaborators you worked with in a text cell at the top of your notebook. Please also number your problems in some way and include comments in your code to indicate what part of a problem you are working on.
Problem 1
Suppose you tracked the number of hours you spent each day talking to an AI for a week. Create a vector with the following values and store it as ai_hours: 2 3 4 2 5 0 4. Use R’s built-in functions to calculate the total number of hours you talked to the AI that week, the average number of hours per day, and the minimum number of hours spent in a single day. Finally, perform a comparison operation on the ai_hours vector to determine which days you spent less than two hours talking to the AI.
Problem 2
Create the matrix given below and store it as my_matrix. Use an R function to return what type of object my_matrix is. Then, perform a mathematical operation on the matrix by multiplying every element by 2. Using the original matrix, perform another operation by adding 10 to every element.
Problem 3
Use data.frame() to create the dataframe shown below. Store the dataframe as syntax. Return the dataframe. Then use one of R’s built in functions to return the structure of the data frame.
                       sentence grammatical rt_ms confidence
1     The cat chased the mouse.        TRUE  1200          5
2     The mouse the cat chased.       FALSE  1800          2
3     Chased the cat the mouse.       FALSE  2000          1
4 The cat, it chased the mouse.        TRUE  1500          4
Problem 4
Use ggplot and the emojifont package to create the following figure! A good place to start is reading the emojifont package docs. Also note that the color aesthetic is set to Penn Blue! Find the hex code for that precise color here.

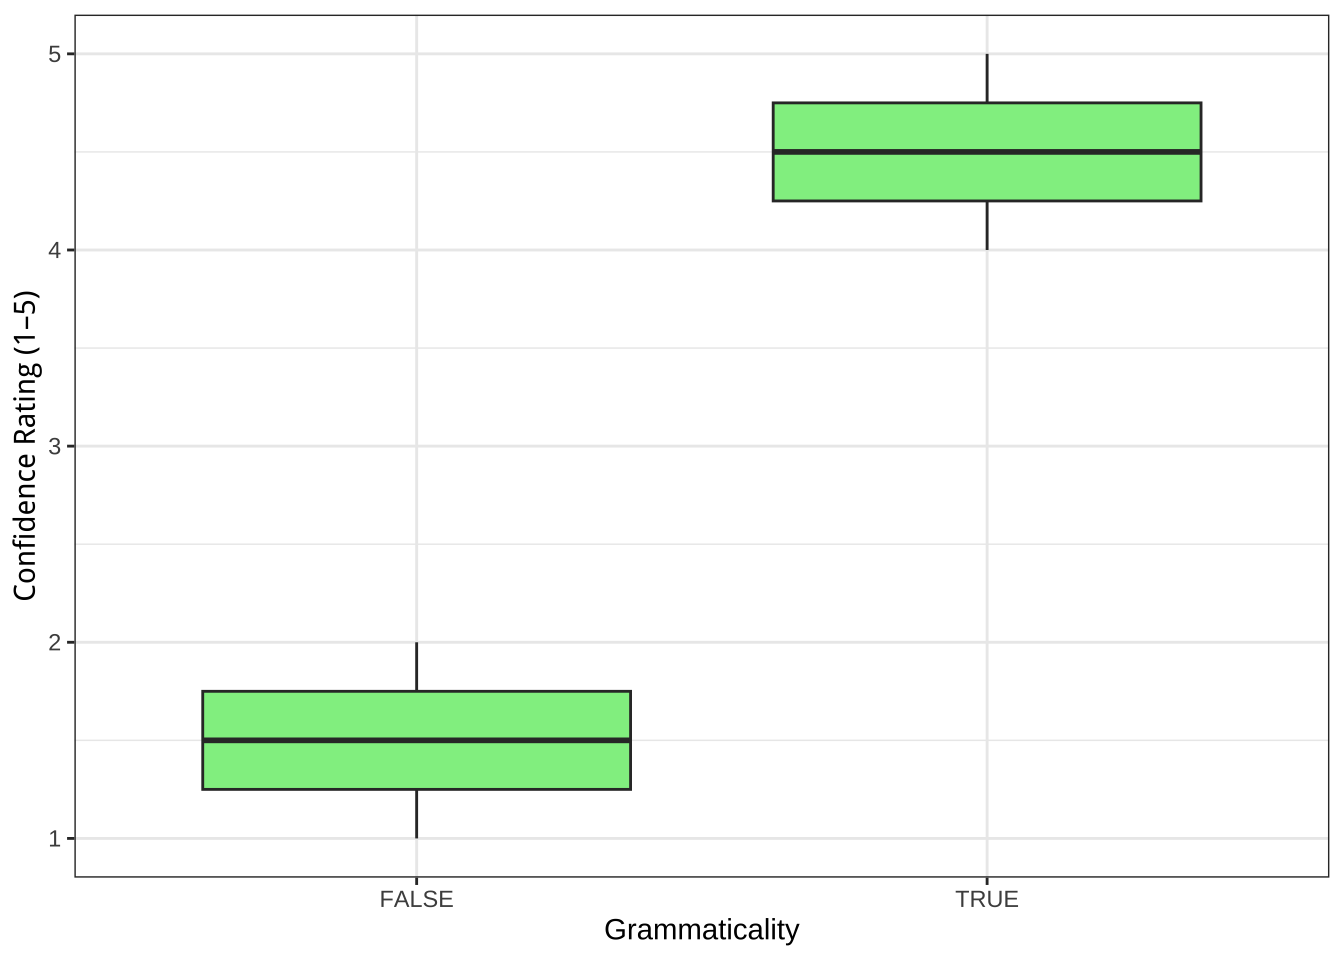
Problem 5
Using the data frame you generated in question 3, recreate the following figure as faithfully as possible. You will need to adjust at least the fill, the theme, the base size of the font, and some axis labels.
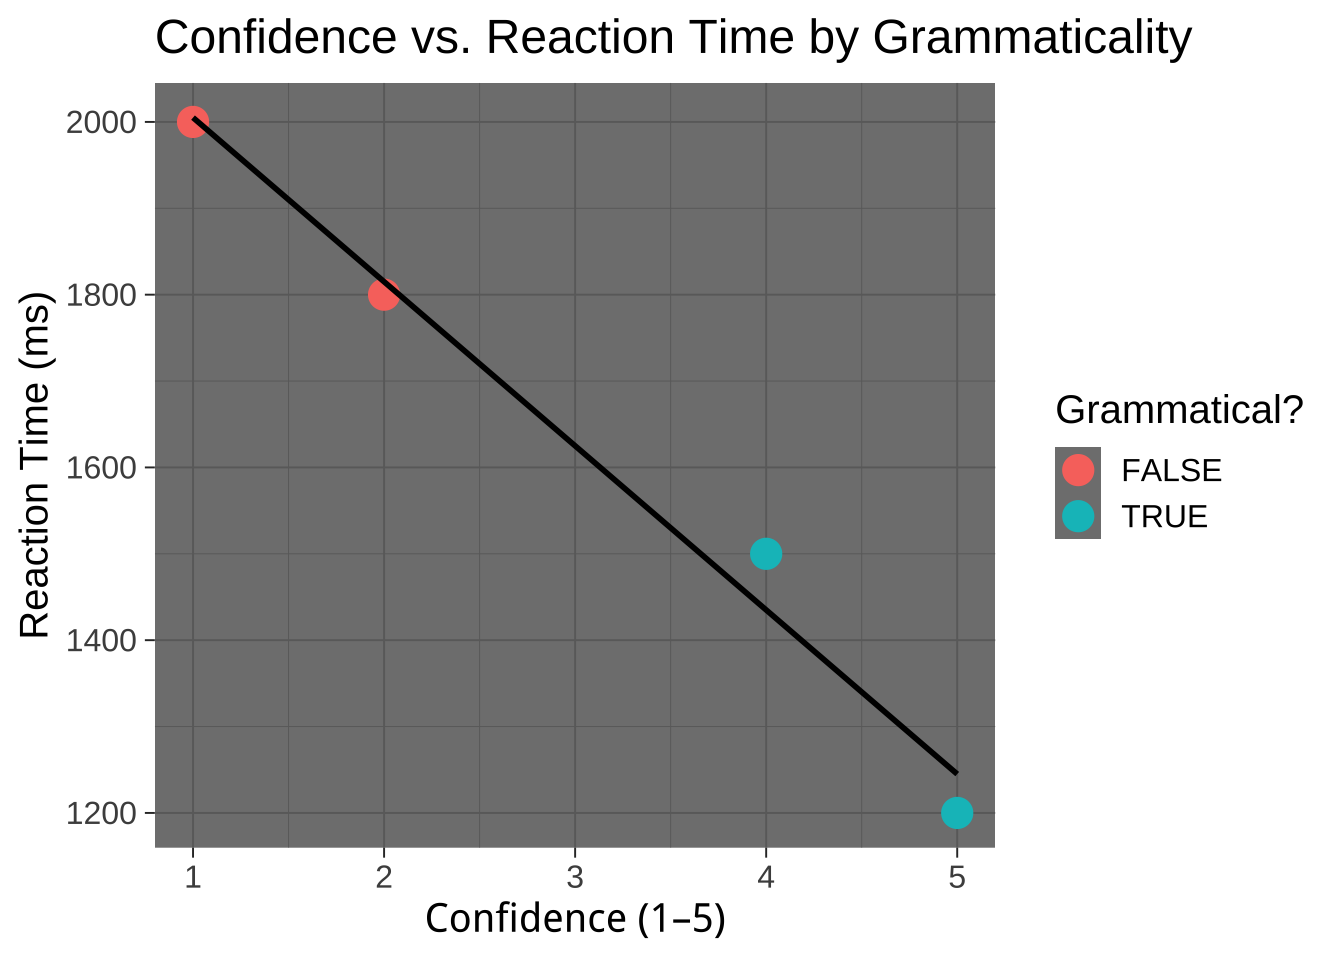
Problem 6
Using the data frame you generated in question 3, recreate the following figure as faithfully as possible. You will need to adjust at least the color and size aesthetics. You’ll need to add more than one geom. You’ll also need to edit the theme, the base size of the font and many labels.